Safety meeting analytics turn tailgate talks into measurable evidence of whether your safety program actually works. The verdict is straightforward: if you run toolbox talks without tracking attendance, action closure, and near-miss trends, you cannot prove effectiveness to OSHA, insurers, or your own leadership. Start with three to four core metrics, build a compact dashboard, pilot it at one site for two to four weeks before scaling further.
TL;DR:
- Tracking attendance and action closure rates provides early warning signs of declining meeting effectiveness and safety culture.
- Using a tiered model of indicators helps identify issues early through leading metrics like participation, near-miss discussions, and topic churn.
- A two- to four-week pilot at a single site is enough to demonstrate improvements in compliance and hazard management before scaling up.
- Automated data collection tools ensure reliable inputs for dashboards, enabling real-time analysis of safety meeting performance.
- Combining site-level dashboards with trend analysis supports targeted coaching, faster corrective actions, and better OSHA or insurer responses.
Table of Contents
- Why Safety Meeting Analytics Matter for Compliance and Outcomes
- Key KPIs to Track for Safety Meeting Effectiveness
- Dashboards and Visualizations That Reveal Effectiveness
- How to Analyze Whether Your Meetings Are Actually Working
- Implementing Safety Meeting Analytics: A Pilot Plan
- How My Safety Solution Maps to These KPIs
- When to Keep It Simple and When to Scale
- Start a Focused Pilot With My Safety Solution
- Sources
- FAQ
Why Safety Meeting Analytics Matter for Compliance and Outcomes
A safety meeting that nobody measures is just a meeting. Analytics turn it into evidence, and the strongest framework for that evidence is dual assurance: tracking both what your teams do in meetings (activity) and what happens afterward (outcomes). A crew can hold a toolbox talk every single week and still see incidents climb if the content never changes or nobody closes the actions raised. Dual assurance catches that gap by pairing activity indicators with outcome indicators for the same risk, an approach industry safety practice increasingly treats as standard for any risk control system.
The payoff shows up in decisions, not just reports:
- Faster corrective action when analytics flag an overdue item before it becomes a repeat citation
- Targeted coaching for specific crews or shifts instead of blanket retraining
- Audit-ready compliance records that hold up when OSHA or an insurer asks for proof
- Early warning when meeting attendance drops before an incident spike, not after
A safety manager who notices near-miss discussion topics repeating across three consecutive weeks can redirect a crew’s meeting topics before that near-miss becomes a recordable.
Key KPIs to Track for Safety Meeting Effectiveness
Not every metric deserves a spot on your dashboard. The KPIs below reflect what actually predicts whether a meeting changes behavior, drawn from the leading and lagging framework industry guidance recommends.
- Attendance and participation rate. Measure signed, time-stamped attendance against scheduled headcount, then track a separate participation flag for workers who ask questions or report a hazard during the session.
- Action item completion rate and average time-to-close. An action logged but never closed is a liability, not a fix. Track both the percentage closed and the average days to closure.
- Near-miss and observation items discussed and closure trends. CCPS process safety metrics guidance treats near-miss reporting as a proactive indicator, not an afterthought.
- Repeat-issue frequency and topic churn. If the same hazard appears in four meetings running, your corrective actions are not sticking.
- Link to outcome measures. Compare meeting KPIs against your OSHA-recordable trend and incident rate over the same period.
Statistic to know: Industry guidance from the API RP 754 fact sheet defines a four-tier model running from Tier 1 lagging indicators to Tier 4 leading indicators, and recommends mixing tiers rather than relying on lagging data alone. A meeting program built entirely on incident counts will always tell you what already went wrong.
Dashboards and Visualizations That Reveal Effectiveness
A dashboard should answer a question in under ten seconds, not require a follow-up email. Structure it in layers, because a site supervisor and a regional safety director need different views of the same data.
- Leadership dashboard: top-line KPIs, trend lines, and a rolling comparison against the prior quarter
- Supervisor drilldowns: the same metrics broken out by crew, site, or shift, so a pattern tied to one foreman does not hide inside a company-wide average
- Trend charts with control-limit logic that flag when a metric moves outside its normal range instead of just plotting a line
- Action-tracking widgets that surface overdue items in red before they age into a compliance gap
- Heat maps and timelines that show which topics recur across sites and when attendance historically dips (holidays, shift changes, weather events)
Platforms built around live, cross-module dashboards, pulling incidents, near misses, audits, and meeting actions into one view, eliminate the end-of-month scramble to assemble a report from four different systems, a pattern Safety Mate’s analytics module documents well. Sample layouts for compliance-focused teams appear in dashboard examples for compliance officers.
How to Analyze Whether Your Meetings Are Actually Working
Raw numbers on a dashboard do not tell you much without a method for reading them. A few techniques separate real signal from noise.
- Run moving averages, not single-month snapshots. A three-month rolling average smooths out the noise from one bad week and shows the real direction.
- Correlate action closure with downstream outcomes, but stay honest about causation. A drop in incidents after faster action closure is a strong signal, not proof, since other variables shift at the same time.
- Watch for red flags: a sustained drop in attendance, a rising count of repeat issues, or action items that take longer to close each month.
- Apply the tiered model from API RP 754 and CCPS: use lagging metrics like incident rate for external reporting, and richer leading indicators, attendance quality, near-miss discussion volume, internally to catch problems early.
Statistic to know: The OECD’s guidance on Safety Performance Indicators frames this as dual assurance: every major risk control needs at least one leading and one lagging indicator, so a program never rests on outcome data alone. A construction crew showing high attendance but a rising repeat-issue count is a program that looks healthy on paper and is not.
Implementing Safety Meeting Analytics: A Pilot Plan
You do not need a company-wide rollout to start proving value. A focused pilot beats a sprawling initiative that stalls before month two.
- Pick three to six core KPIs and assign a data owner to each one. Define the measurement unit up front (percentage, days, count) so nobody argues about it later.
- Run a two to four week pilot at a single site. Collect a baseline, then adjust the KPI list before expanding to other sites.
- Standardize your meeting templates and action categories. Consistency here is what makes cross-site comparison possible at all; toolbox talk templates give a practical starting structure.
- Assign dashboard ownership and a review cadence: weekly for operational review, monthly for leadership reporting.
Pro Tip: Do not wait for a perfect data set before launching the pilot. Start with attendance and action closure, the two easiest metrics to collect cleanly, and add near-miss tracking once the habit is established.
How My Safety Solution Maps to These KPIs
Every KPI above requires reliable input data, and that is precisely where most paper-based and spreadsheet-based programs break down. My Safety Solution automates the collection layer so the analytics have something solid to work from:
- Automated, signed attendance tracking replaces manual sign-in sheets prone to gaps and illegible names
- AI-generated safety topics keep meeting content relevant to current hazards, reducing the topic churn that signals a stale program
- Built-in action tracking flags overdue items automatically instead of relying on a supervisor’s memory
- Centralized reporting links meeting data to compliance records for audit readiness
Companies using automated meeting management report improved compliance records and fewer incidents, a client-reported outcome that lines up with the dual-assurance logic covered above. For deeper templates and field-tested checklists, the safety compliance metrics guide from Matthew Hoffman is a useful next stop.
When to Keep It Simple and When to Scale
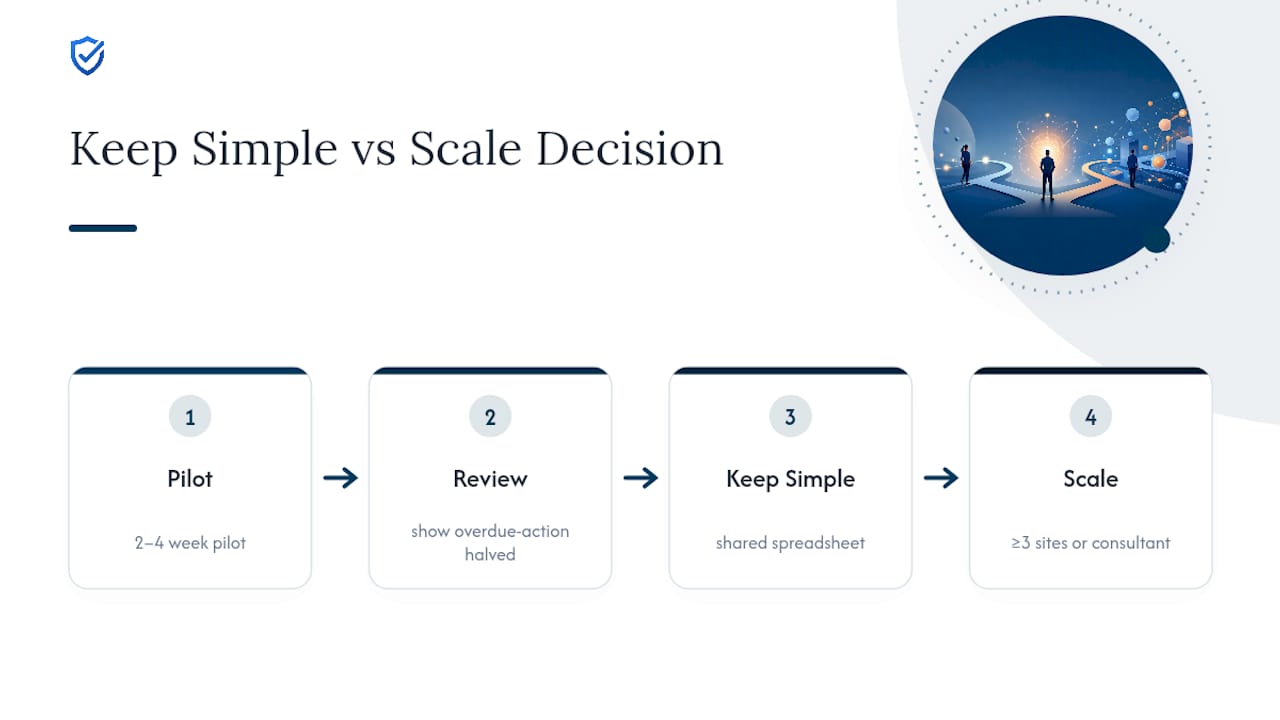
Not every crew needs a full dashboard on day one. A five-person crew running weekly toolbox talks can track attendance and action closure on a shared spreadsheet for a month or two, and that is a reasonable starting point, not a shortcut. The moment you have three or more sites, or a safety consultant managing several client accounts, manual tracking stops scaling and starts creating the exact gaps analytics are supposed to catch.
In the first three months, expect modest, believable gains: cleaner attendance records, faster action closure, maybe a 10 to 15 percent drop in overdue items. Do not promise leadership an incident-rate miracle in month one. Secure buy-in with the small, visible win, an overdue-action count cut in half, before asking for budget to scale further.
— Matthew Hoffman
Start a Focused Pilot With My Safety Solution
Spreadsheets and paper logs cannot generate the trend data this article just walked through. They can record that a meeting happened, but they cannot flag an overdue action automatically or surface a repeat-issue pattern before it becomes a citation. My Safety Solution closes that gap by automating attendance, action tracking, and topic generation from day one, so your dashboard has clean data to analyze instead of a pile of scanned sign-in sheets.
A two to four week pilot is the fastest way to see the difference. Start with the Starter plan at $99 per month if you are testing this at a single site, or step up to Growth at $199 per month if you are managing multiple crews from day one. Visit the pricing page to compare plans, or explore the full platform overview to see how attendance, action tracking, and reporting come together before you commit.
Sources
Analytics are only as good as the inputs feeding them. Reliable meeting data starts with a defined set of fields, collected the same way every time.
Donesafe’s safety meeting module illustrates this well: it schedules meetings, records attendance, tracks actions, and links that data to incident and training modules so the reporting layer stays unified rather than scattered across spreadsheets.
Pro Tip: Assign one field owner per data category, attendance, actions, topics, so nobody argues later about which spreadsheet was the real record. A single source of truth beats three “close enough” versions every time.
FAQ
What Are KPIs for Safety Meetings?
KPIs for safety meetings measure both activity and outcomes: attendance rate, action item completion, near-miss items discussed, and repeat-issue frequency. Effective programs pair a leading indicator (attendance, participation) with a lagging one (incident rate) for the same risk area, following the dual-assurance approach outlined in OECD guidance.
What Are the 5 E’s of Workplace Safety?
Definitions vary across the industry, but the concept generally refers to Education, Engineering, Enforcement, Evaluation, and Encouragement as pillars of a safety program. Meeting analytics feed directly into the Evaluation pillar by giving you measurable proof of what is working.
What Should a Safety Meeting Include?
A well-structured safety meeting includes signed attendance, a specific hazard topic tied to current site conditions, a review of open action items, and a brief window for workers to report near-misses or concerns. Standardized toolbox talk templates make this consistent across crews and easier to analyze later.
What Are the Top Topics for Safety Meetings?
Top topics typically include fall protection, hazard communication, personal protective equipment, equipment-specific hazards, and near-miss review, though the right mix depends on your site’s incident history and current risk profile. A manager’s guide to safety meeting topics breaks these down by industry and season.
How Much Does My Safety Solution Cost?
My Safety Solution offers a Starter plan at $99 per month and a Growth plan at $199 per month, with a Business plan at $299 per month for larger teams. Enterprise pricing is available on request through the pricing page.